
Stock Market Sentiment Analysis in Python
Do you know that the everyday news have an impact on the stock market?
Most stock investors make decisions on whether to buy or sell their stocks based on the trending news.
If you realize that the price of a particular stock will rise, you can buy the stock.
On the other hand, if you realize that the price of the stock will decline, you can sell it.
This is key for you to trade stocks profitably.
You can use financial sentiment analysis to extract insights about stocks from news articles, social media, and financial reports to determine whether to buy or sell a stock.
In this article, I will help you know how to perform stock sentiment analysis in Python.
Table of Contents
You can skip to a specific section of this stock market sentiment analysis tutorial using the table of contents below:
What is Sentiment Analysis?
Sentiment analysis, also known as opinion mining, is a natural language processing technique used to establish whether data is positive, neutral, or negative.
Computers use natural language processing to extract meanings behind images, text, and other data.
Companies apply sentiment analysis on textual data to monitor product and brand sentiment in customer feedback and understand the needs of customers.
Nowadays, customers have learnt to express their thoughts and feelings openly, hence, sentiment analysis has become an essential tool for monitoring and understanding segments.
When brands analyze customer feedback like social media conversations and opinions in survey responses, they can know what makes their customers happy or unhappy.
The brand can then customize its products to meet the needs of its customers.
For example, if you use sentiment analyze to analyze 2,000+ reviews about your product, you can know whether customers are happy about your customer service and pricing plans.
When it comes to the stock market, you can use sentiment analysis to analyze news headlines about a particular stock.
From this, you can tell whether the price of a stock is headed in a positive or a negative direction.
Sentiment Analysis of Stocks using Python
In this section, we will be extracting stock sentiments from FinViz website using Python.
We will be targeting the headlines of the financial news that are published on the website.
The FinViz website is a great source of information about the stock market.
You can access it by opening the following URL on your web browser:
To get the news about a stock for a particular company, just use the search bar to search for it .
For example, the following figure shows the news headlines section for Amazon:
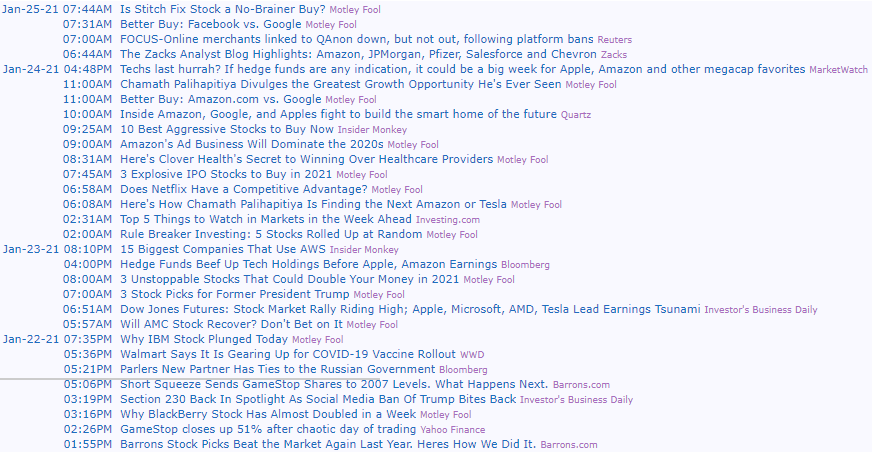
Instead of going through each headline for every stock that you're interested in, you can use Python to parse the website data and perform sentiment analysis (by assigning a sentiment score) for every headline and then average it over a period of time.
So, let's see how you can do this in Python:
Import Libraries
We will first import the libraries that we will use to store the data.
We will use the BeautifulSoup library to parse data from the website and the requests library to get the data.
The Pandas library will be used to store the data in its DataFrame objects while the Matplotlib library will be used to visualize the data.
After getting the data, we will use the nltk.sentiment.vader library to perform sentiment analysis on the news headlines.
import os
import matplotlib.pyplot as plt
from bs4 import BeautifulSoup
import pandas as pd
from urllib.request import urlopen, Request
from nltk.sentiment.vader import SentimentIntensityAnalyzer
To parse the website, you should add the stock ticker to the end of the following URL:
https://finviz.com/quote.ashx?t=
For example, the stock ticker for the Amazon stock is AMZN, hence, we can parse the website using the following code:
url = 'https://finviz.com/quote.ashx?t=AMZN'Store the Data
We will extract and store the date, the time, and the news headlines data.
First, let's inspect the HTML code for the news headline section.
Right click inside the news section and choose "Inspect".
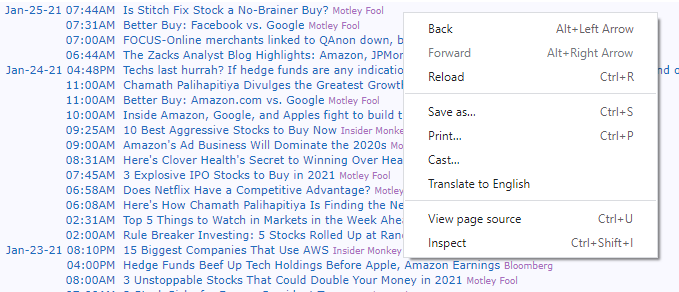
The HTML code will be shown on the right side of the screen:
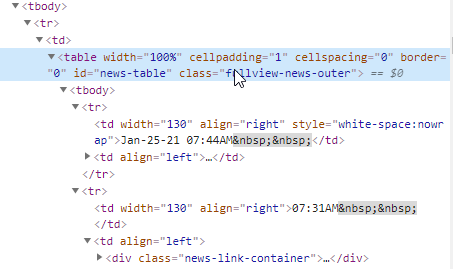
The code shows that the news have been stored in a table with id=news-table.
Each news headline has been put in its own row using the <tr> and </tr> tags.
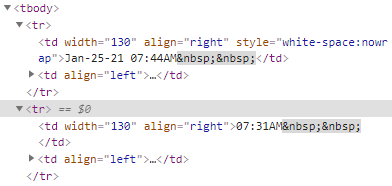
The date and time data has been nested within the <td> and </td> tags, while the news headline text has been nested between <a> and </a> tags.
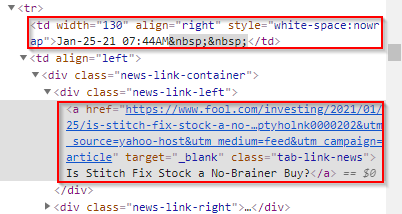
So, our goal is to extract the date, time, and news headline per row and perform sentiment analysis on the news headline.
We now want to extract the entire news table for three stocks, Amazon (AMZN), Google (GOOG), and Tesla (TSLA).
The data will be stored in a Python dictionary:
web_url = 'https://finviz.com/quote.ashx?t='

news_tables = {}
tickers = ['AMZN', 'GOOG', 'TSLA']

for tick in tickers:
    url = web_url + tick
    req = Request(url=url,headers={"User-Agent": "Chrome"})
    response = urlopen(req)
    html = BeautifulSoup(response,"html.parser")
    news_table = html.find(id='news-table')
    news_tables[tick] = news_table
First, we created a Python dictionary named news_tables.
We then specified the tickers for the three stocks we are interested in.
The for loop will make 3 iterations, extracting news data for one of the stocks per iteration.
Print the Data
We now have a dictionary named news_data with data.
If you execute the code and type the name of the dictionary on the Python terminal, you'll see it has a huge txt:
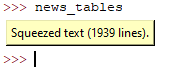
Let's display the contents of the news_tables for AMZN.
The code will iterate through the <tr></tr> tags to extract the date and time from <td></td> tags and the headlines from the <a></a> tags.
amazon = news_tables['AMZN']
amazon_tr = amazon.findAll('tr')

for x, table_row in enumerate(amazon_tr):
    a_text = table_row.a.text
    td_text = table_row.td.text
    print(a_text)
    print(td_text)
    if x == 3:
        break
The code should return something like this:
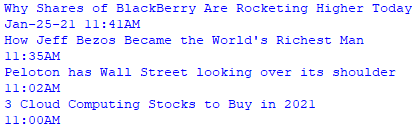
Notice the use of an if condition that helps us extract only the first 4 rows from the data.
Parse the Data into a Python List
We now want to write some code to parse the date, the time, and the headlines into a Python List called news_list.
A closer look at the news headlines reveals that only the first news of each day has the date label.
To account for this, we will use an if...else loop.
news_list = []

for file_name, news_table in news_tables.items():
    for i in news_table.findAll('tr'):

        text = i.a.get_text()

        date_scrape = i.td.text.split()

        if len(date_scrape) == 1:
            time = date_scrape[0]

        else:
            date = date_scrape[0]
            time = date_scrape[1]

        tick = file_name.split('_')[0]

        news_list.append([tick, date, time, text])
The first for loop will iterate over the news, while the second for loop will iterate over all <tr> tags in the news_table.
The .get_text() function will extract the text placed within the <tr> tag, but it will only get the text placed within the <a> tag.
The .split() function will split the text placed in <td> tag into a list.
If the length of the split data is 1, time will be loaded as the only element.
Otherwise, date will be loaded as the first element and time as the second.
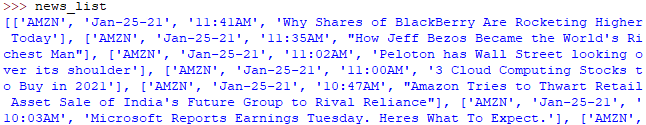
You can execute the code and type news_list on the Python terminal.
The result will be a list of lists with part of it looking as follows:
Sentiment Analysis
We can now use nltk.sentiment.vader to perform sentiment analysis.
We will first store the ticker, the date, the time, and the headlines in a DataFrame.
Next, we will perform sentiment analysis on the headlines and then add an additional column to our DataFrame to store the sentiment scores per headline:
vader = SentimentIntensityAnalyzer()

columns = ['ticker', 'date', 'time', 'headline']

news_df = pd.DataFrame(news_list, columns=columns)

scores = news_df['headline'].apply(vader.polarity_scores).tolist()

scores_df = pd.DataFrame(scores)

news_df = news_df.join(scores_df, rsuffix='_right')

news_df['date'] = pd.to_datetime(news_df.date).dt.date

print(news_df.head())
The .head() function will return the first 5 rows of the DataFrame as shown below:
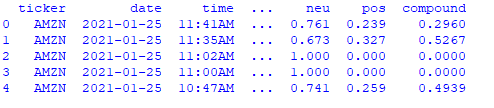
The compound column gives us the sentiment scores.
A higher positive value is an indication that the sentiment is more positive.
A more negative value is an indication that the sentiment is more negative.
The scores should range between -1 and 1.
Visualize the Sentiment Scores
We can now plot a bar chart that visualizes the sentiment score for each day.
Let's create a code that takes the average of the sentiment scores for all the news headlines collected during each date and visualize it on a bar chart.
You can also get the average of the scores for every week in order to get the overall sentiment for a week.
plt.rcParams['figure.figsize'] = [10, 6]
mean_scores = news_df.groupby(['ticker','date']).mean()
mean_scores = mean_scores.unstack()
mean_scores = mean_scores.xs('compound', axis="columns").transpose()
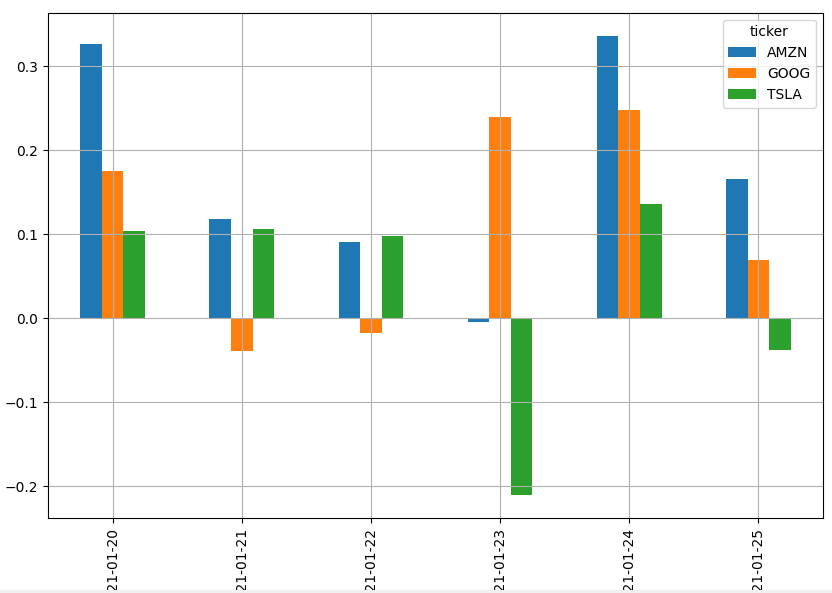
mean_scores.plot(kind = 'bar')
plt.grid()
plt.show()We first grouped the results by the ticker and date columns then invoked the .mean() function to calculate the mean.
The .unstack() function helped us to unstack the ticker column.
The .transpose() function helped us obtain the cross-section of compound in the columns axis.
We then invoked the .plot() function and set the kind of plot to bar.
The code will generate the following bar chart:
Congratulations!
That's how to perform sentiment analysis on stocks using Python.
Final Thoughts
This is what you've learnt in this article:
- Sentiment analysis is a data mining technique used by companies to determine whether a sentiment is postive or negative.
- It is the technique used by computers to get the meaning behind texts, images, and other types of data.
- You can use sentiment analysis to analyze customer feedback and know whether they are happy or unhappy with your brand.
- You can also use sentiment analysis to analyze the news headlines about the stocks you're interested in. This will tell you more about the health of the stock.
- Python is a great Sentiment Analysis tool because there are many Python libraries for performing sentiment analysis tasks.